Plots With PyVista
We provide here a tutorial on how to make pretty visuals from GCM simulations. Do not hesitate to send us your best visuals so that we can enrich our GCM plot gallery.
We first import all the required libraries:
- netCDF4 (https://pypi.org/project/netCDF4/) to read NetCDF files in Python.
- PyVista (https://docs.pyvista.org/getting-started/installation.html)
ps: the diagfi.nc file as well as the Jupyter notebook are provided here: https://web.lmd.jussieu.fr/~mturbet/PyVista_GCM_plot_tutorial/
ps2: the diagfi.nc file was produced following the quick install & run tutorial that you can follow here: https://lmdz-forge.lmd.jussieu.fr/mediawiki/Planets/index.php/Quick_Install_and_Run
import pyvista as pv
import numpy as np
from netCDF4 import Dataset
First, we get the data from the GCM and extract all fields to be plotted later.
# 4D GRID VARIABLES
nc1 = Dataset('diagfi_benchmark_early_Mars.nc')

Time_GCM=nc1.variables['Time'][:]
lat_GCM=nc1.variables['latitude'][:]
lon_GCM=nc1.variables['longitude'][:]
alt_GCM=nc1.variables['altitude'][:]
aire_GCM=nc1.variables['aire'][:][:]

resolution_lon_GCM = abs(lon_GCM[1]-lon_GCM[0])
resolution_lat_GCM = abs(lat_GCM[1]-lat_GCM[0])

# 2D VARIABLES
tsurf1=nc1.variables['tsurf'][:][:][:]
h2o_ice_col1=nc1.variables['h2o_ice_col'][:][:][:]

# 3D VARIABLES
u1=nc1.variables['u'][:][:][:][:]
v1=nc1.variables['v'][:][:][:][:]
w1=nc1.variables['w'][:][:][:][:]
ice1=nc1.variables['h2o_ice'][:][:][:][:]
We define coordinates to be used by PyVista.
# DEFINE REFERENCE RADIUS OF THE PLANET
RADIUS = 1.0

# Longitudes and latitudes used to plot the GCM simulation
x = lon_GCM[0:len(lon_GCM)-1]+180.
y = lat_GCM[0:len(lat_GCM)]

# Define polar coordinates
y_polar = 90.0 - y  # grid_from_sph_coords() expects polar angle


# FUNCTION TO CALCULATE COORDINATE CELL BOUNDARIES
def _cell_bounds(points, bound_position=0.5):
    """
    Calculate coordinate cell boundaries.

    Parameters
    ----------
    points: numpy.array
        One-dimensional array of uniformly spaced values of shape (M,)
    bound_position: bool, optional
        The desired position of the bounds relative to the position
        of the points.

    Returns
    -------
    bounds: numpy.array
        Array of shape (M+1,)

    Examples
    --------
    >>> a = np.arange(-1, 2.5, 0.5)
    >>> a
    array([-1. , -0.5,  0. ,  0.5,  1. ,  1.5,  2. ])
    >>> cell_bounds(a)
    array([-1.25, -0.75, -0.25,  0.25,  0.75,  1.25,  1.75,  2.25])
    """
    assert points.ndim == 1, "Only 1D points are allowed"
    diffs = np.diff(points)
    delta = diffs[0] * bound_position
    bounds = np.concatenate([[points[0] - delta], points + delta])
    return bounds


# Create arrays of grid cell boundaries, which have shape of (x.shape[0] + 1)
xx_bounds = _cell_bounds(x)
yy_bounds = _cell_bounds(y_polar)
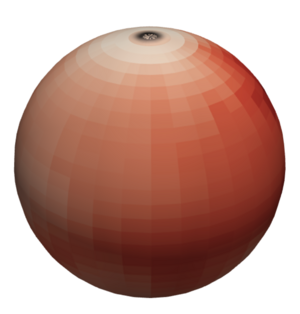
1. We prepare the surface layer (here using surface temperature)
surface_level = [RADIUS] # surface level
grid_scalar1 = pv.grid_from_sph_coords(xx_bounds, yy_bounds, surface_level)

scalar_surface = np.zeros((len(lat_GCM),len(lon_GCM)-1),dtype='f')
for i_time in range(0,len(Time_GCM),1):
    for i in range(0,len(lat_GCM),1):
        for j in range(0,len(lon_GCM)-1,1):
            scalar_surface[i,j]=scalar_surface[i,j]+tsurf1[i_time,i,j]/len(Time_GCM)

grid_scalar1.cell_arrays["example"] = np.array(scalar_surface).swapaxes(-2, -1).ravel("C")
We make a first plot.
# FIRST PLOT

p = pv.Plotter(1)
p.add_mesh(grid_scalar1, opacity=1.0, cmap="Reds", smooth_shading="True",show_scalar_bar=False) #clim=[1,1],
p.camera_position = 'yz'
p.camera.azimuth = 130.
p.camera.roll =270
p.camera.elevation = 30
p.set_background('white')
p.screenshot("surface_temperature_only.png",window_size=[1000,1000])#, transparent_background=True)
p.show()
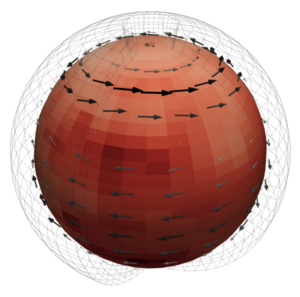
2. We create the 3D spherical shell (3D grid lines)
radial_shell = np.linspace(0, RADIUS*1.2, 15)
xx_shell, yy_shell, zz_shell = np.meshgrid(np.radians(np.arange(90, 365, resolution_lon_GCM)), np.radians(np.arange(-84, 84, resolution_lat_GCM)), radial_shell)
# Transform to spherical coordinates
x_shell = zz_shell * np.cos(yy_shell) * np.cos(xx_shell)
y_shell = zz_shell * np.cos(yy_shell) * np.sin(xx_shell)
z_shell = zz_shell * np.sin(yy_shell)
grid_shell = pv.StructuredGrid(x_shell, y_shell, z_shell)
grid_shell['radials'] = zz_shell.ravel(order='F')
We make a second plot
p = pv.Plotter(1)
p.add_mesh(grid_scalar1, opacity=1.0, cmap="Reds", smooth_shading="True",show_scalar_bar=False) #clim=[1,1],
p.add_mesh(grid_shell, style='wireframe',cmap='Greys',opacity=0.1,show_scalar_bar=False)
p.camera_position = 'yz'
p.camera.azimuth = 30.
p.camera.roll =270
p.camera.elevation = 30
p.set_background('white')
p.screenshot("surface_temperature_with_grid.png",window_size=[1000,1000])#, transparent_background=True)
p.show()
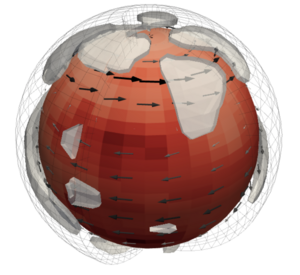
3. We prepare for the array of wind arrows.
# 3. PREPARE THE WIND LAYER

freq_call_wind=2 # used to change the frequency of wind pattern
MULT_FACTOR_ZWIND=100. # scaling factor of vertical wind so that we can see it in the plot
wind_level = [RADIUS * 1.02] # altitude of the wind layer (on the plot)

i_alt=13 # altitude of the wind layer (in the GCM data)

scalar_u_wind = np.zeros((len(lat_GCM),len(lon_GCM)-1),dtype='f')
scalar_v_wind = np.zeros((len(lat_GCM),len(lon_GCM)-1),dtype='f')
scalar_w_wind = np.zeros((len(lat_GCM),len(lon_GCM)-1),dtype='f')

for i_time in range(0,len(Time_GCM),1):
    for i in range(0,len(lat_GCM),1):
        for j in range(0,len(lon_GCM)-1,1):
            scalar_u_wind[i,j]=scalar_u_wind[i,j]+u1[i_time,i_alt,i,j]/len(Time_GCM)
            scalar_v_wind[i,j]=scalar_v_wind[i,j]+v1[i_time,i_alt,i,j]/len(Time_GCM)
            scalar_w_wind[i,j]=scalar_w_wind[i,j]+w1[i_time,i_alt,i,j]/len(Time_GCM)

inv_axes = [*range(scalar_u_wind[::freq_call_wind,::freq_call_wind].ndim)[::-1]]
# Transform vectors to cartesian coordinates
vectors = np.stack(
        [
            i.transpose(inv_axes).swapaxes(-2, -1).ravel("C")
            for i in pv.transform_vectors_sph_to_cart(
                x[::freq_call_wind],
                y_polar[::freq_call_wind],
                wind_level[::freq_call_wind],
                scalar_u_wind[::freq_call_wind,::freq_call_wind].transpose(inv_axes),
                -scalar_v_wind[::freq_call_wind,::freq_call_wind].transpose(inv_axes),  # Minus sign because y-vector in polar coords is required
                -MULT_FACTOR_ZWIND*scalar_w_wind[::freq_call_wind,::freq_call_wind].transpose(inv_axes),
            )
        ],
        axis=1,
    )
# Scale vectors to make them visible
vectors *= RADIUS * 0.01
# Create a grid for the vectors
grid_winds = pv.grid_from_sph_coords(x[::freq_call_wind], y_polar[::freq_call_wind], wind_level)
# Add vectors to the grid
grid_winds.point_arrays["example"] = vectors
We make a third plot.
p = pv.Plotter(1)
p.add_mesh(grid_scalar1, opacity=1.0, cmap="Reds", smooth_shading="True",show_scalar_bar=False) #clim=[1,1],
p.add_mesh(grid_shell, style='wireframe',cmap='Greys',opacity=0.1,show_scalar_bar=False)
p.add_mesh(grid_winds.glyph(orient="example", scale="example", tolerance=0.005),cmap="binary",show_scalar_bar=False)
p.camera_position = 'yz'
p.camera.azimuth = 30.
p.camera.roll =270
p.camera.elevation = 30
p.set_background('white')
p.screenshot("surface_temperature_with_grid_with_winds.png",window_size=[1000,1000])#, transparent_background=True)
p.show()
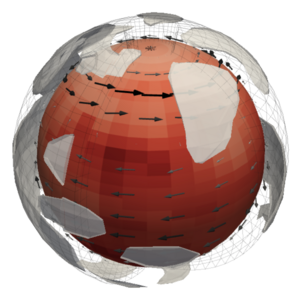
4.1 We create a cloud layer (first option using 2D cloud layer)
# Number of vertical levels
nlev = 3
table_level=np.arange(nlev)

# artificial empty layers above and below the clouds
table_level[0]=0.
table_level[1]=1.
table_level[2]=0.


scalar_cloud = np.zeros((len(lat_GCM),len(lon_GCM)-1),dtype='f')
for i_time in range(0,len(Time_GCM),1):
    for i in range(0,len(lat_GCM),1):
        for j in range(0,len(lon_GCM)-1,1):
            scalar_cloud[i,j]=scalar_cloud[i,j]+h2o_ice_col1[i_time,i,j]/len(Time_GCM)

# 3D cloud layer
scalar_cloud_3d = (
scalar_cloud.repeat(nlev).reshape((*scalar_cloud.shape, nlev)) * table_level[np.newaxis, np.newaxis, :]).transpose(2, 0, 1)

# geometry of the grid
z_scale = RADIUS/20.
levels2 = z_scale * (np.arange(scalar_cloud_3d.shape[0] + 1)) + RADIUS*1.01
print (levels2)

# Create a structured grid by transforming coordinates
grid_scalar_cloud_3d = pv.grid_from_sph_coords(xx_bounds, yy_bounds, levels2)

# Add data to the grid
grid_scalar_cloud_3d.cell_arrays["example"] = np.array(scalar_cloud_3d).swapaxes(-2, -1).ravel("C")

# Create a set of isosurfaces
surfaces_cloud = grid_scalar_cloud_3d.cell_data_to_point_data().contour(isosurfaces=[0.00005])
We make a fourth plot.
p = pv.Plotter(1)
p.add_mesh(grid_scalar1, opacity=1.0, cmap="Reds", smooth_shading="True",show_scalar_bar=False) #clim=[1,1],
p.add_mesh(grid_shell, style='wireframe',cmap='Greys',opacity=0.1,show_scalar_bar=False)
p.add_mesh(grid_winds.glyph(orient="example", scale="example", tolerance=0.005),cmap="binary",show_scalar_bar=False)
p.add_mesh(surfaces_cloud,cmap="Greys",opacity=0.7,show_scalar_bar=False)
p.camera_position = 'yz'
p.camera.azimuth = 30.
p.camera.roll =270
p.camera.elevation = 30
p.set_background('white')
p.screenshot("surface_temperature_with_grid_with_winds_with_2D_clouds.png",window_size=[1000,1000])#, transparent_background=True)
p.show()
4.2 We create a cloud layer (second, more advanced option using 3D cloud layer)
# Get the 3D field of water ice clouds
scalar_ice = np.zeros((len(lat_GCM),len(lon_GCM)-1,len(alt_GCM)),dtype='f')
for i_time in range(0,len(Time_GCM),1):
    for i in range(0,len(lat_GCM),1):
        for j in range(0,len(lon_GCM)-1,1):
            for k in range(0,len(alt_GCM),1):
                scalar_ice[i,j,k]=scalar_ice[i,j,k]+ice1[i_time,k,i,j]/len(Time_GCM)

nlev = len(alt_GCM)+1
table_level=np.arange(nlev)

# geometry of the grid
z_scale = RADIUS/50.
levels2 = RADIUS*1.01+ z_scale * table_level

# 3D cloud layer
scalar_cloud_3d = (np.clip(scalar_ice,0,1.0e8)).transpose(2, 0, 1) # clip to a=amax

# Create a structured grid by transforming coordinates
grid_scalar_cloud_3d = pv.grid_from_sph_coords(xx_bounds, yy_bounds, levels2)

# Add data to the grid
grid_scalar_cloud_3d.cell_arrays["example"] = np.array(scalar_cloud_3d).swapaxes(-2, -1).ravel("C")

# Create a set of isosurfaces
surfaces_cloud = grid_scalar_cloud_3d.cell_data_to_point_data().contour(isosurfaces=[0.9e-8])
We make a fifth plot.
p = pv.Plotter(1)
p.add_mesh(grid_scalar1, opacity=1.0, cmap="Reds", smooth_shading="True",show_scalar_bar=False) #clim=[1,1],
p.add_mesh(grid_shell, style='wireframe',cmap='Greys',opacity=0.1,show_scalar_bar=False)
p.add_mesh(grid_winds.glyph(orient="example", scale="example", tolerance=0.005),cmap="binary",show_scalar_bar=False)
p.add_mesh(surfaces_cloud,cmap="Greys",opacity=0.7,show_scalar_bar=False)
p.camera_position = 'yz'
p.camera.azimuth = 30.
p.camera.roll =270
p.camera.elevation = 30
p.set_background('white')
p.screenshot("surface_temperature_with_grid_with_winds_with_3D_clouds.png",window_size=[1000,1000])#, transparent_background=True)
p.show()
We make a first series of .png files (rotating the azimuth angle) to be used to build a .gif animated plot.
total_step_gif=100
for i in range(0,total_step_gif,1):
    p = pv.Plotter(i)
    p.add_mesh(grid_scalar1, opacity=1.0, cmap="Reds", smooth_shading="True",show_scalar_bar=False) #clim=[1,1],
    p.add_mesh(grid_shell, style='wireframe',cmap='Greys',opacity=0.1,show_scalar_bar=False)
    p.add_mesh(grid_winds.glyph(orient="example", scale="example", tolerance=0.005),cmap="binary",show_scalar_bar=False)
    p.add_mesh(surfaces_cloud,cmap="Greys",opacity=0.7,show_scalar_bar=False)
    p.camera_position = 'yz'
    p.camera.azimuth = i*360/total_step_gif
    p.camera.roll += 0.
    p.camera.elevation = 30
    p.set_background('white')
    if(i<10):
        p.screenshot("gif_planet_000"+str(i)+".png",window_size=[1000,1000])#, transparent_background=True)
    if((i>=10) and (i_time<100)):
        p.screenshot("gif_planet_00"+str(i)+".png",window_size=[1000,1000])#, transparent_background=True)
    if((i>=100) and (i_time<1000)):
        p.screenshot("gif_planet_0"+str(i)+".png",window_size=[1000,1000])#, transparent_background=True)
    if((i>=1000) and (i_time<10000)):
        p.screenshot("gif_planet_"+str(i)+".png",window_size=[1000,1000])#, transparent_background=True)
    print("we are at step = ", i, "/",total_step_gif)

print('FINISHED')
To build a gif, you can use the imagemagick convert tool (https://imagemagick.org/script/download.php) using for instance the following command line:
convert -delay 10 gif_planet_*.png animated_planet.gif
We make a second series of .png files (rotating not only the azimuth angle, but also the elevation of the camera) to be used to build a .gif animated plot.
total_step_gif=100
for i in range(0,total_step_gif,1):
    p = pv.Plotter(i)
    p.add_mesh(grid_scalar1, opacity=1.0, cmap="Reds", smooth_shading="True",show_scalar_bar=False) #clim=[1,1],
    p.add_mesh(grid_shell, style='wireframe',cmap='Greys',opacity=0.1,show_scalar_bar=False)
    p.add_mesh(grid_winds.glyph(orient="example", scale="example", tolerance=0.005),cmap="binary",show_scalar_bar=False)
    p.add_mesh(surfaces_cloud,cmap="Greys",opacity=0.7,show_scalar_bar=False)
    p.camera_position = 'yz'
    p.camera.azimuth = i*360/total_step_gif
    p.camera.roll += 0.
    p.camera.elevation = 45+15*np.cos((i*360/total_step_gif)*np.pi/180.)
    p.set_background('white')
    if(i<10):
        p.screenshot("gif_planet_000"+str(i)+".png",window_size=[1000,1000])#, transparent_background=True)
    if((i>=10) and (i_time<100)):
        p.screenshot("gif_planet_00"+str(i)+".png",window_size=[1000,1000])#, transparent_background=True)
    if((i>=100) and (i_time<1000)):
        p.screenshot("gif_planet_0"+str(i)+".png",window_size=[1000,1000])#, transparent_background=True)
    if((i>=1000) and (i_time<10000)):
        p.screenshot("gif_planet_"+str(i)+".png",window_size=[1000,1000])#, transparent_background=True)
    print("we are at step = ", i, "/",total_step_gif)

print('FINISHED')
Another method allows us to directly generate the gif, without generating all the pictures.
#FINALLY WE MAKE THE GIF
total_step_gif=100
p = pv.Plotter(notebook=False, off_screen=True)
p.add_mesh(grid_scalar1, opacity=1.0, cmap="Reds", smooth_shading="True",show_scalar_bar=False) #clim=[1,1],
p.add_mesh(grid_shell, style='wireframe',cmap='Greys',opacity=0.1,show_scalar_bar=False)
p.add_mesh(grid_winds.glyph(orient="example", scale="example", tolerance=0.005),cmap="binary",show_scalar_bar=False)
p.add_mesh(surfaces_cloud,cmap="Greys",opacity=0.7,show_scalar_bar=False)
p.camera_position = 'yz'
# Open a gif
p.open_gif("nom_du_gif.gif")
for i in range(0,total_step_gif,1):
    p.camera_position = 'yz'
    p.camera.azimuth = i*360/total_step_gif
    p.camera.roll += 0.
    p.camera.elevation = 30
    p.set_background('white')
    # Write a frame. This triggers a render.
    p.write_frame()
# Closes and finalizes movie
p.close()
Last words: Do not hesitate to send us your best visuals so that we can enrich our GCM plot gallery! Do not hesitate as well to update this page with additional features of PyVista :)


