HowTo: Profiling LMDZ
Profiling with gprof
The legacy way to profile the model is using gprof.
- Pros: available everywhere, easy to use
- Cons: old, bad handling of multithreaded applications, requires instrumentation
gprof is a rudimentary but simple to use tool to profile a sequential executable.
Note: a new tool gprofng is currently being developed with several notable improvements including multithreading support. As of 06/24, it doesn't support Fortran yet.
Instrumenting the code
In the .fcm arch file used, add -pg to BASE_FFLAGS and BASE_LD. Recompile the model.
Collecting statistics
Run the executable gcm.e. This will generate a gmon.out file locally.
Reading results
Run gprof gcm.e gmon.out > profiling.txt to get a textual view of the profiling.
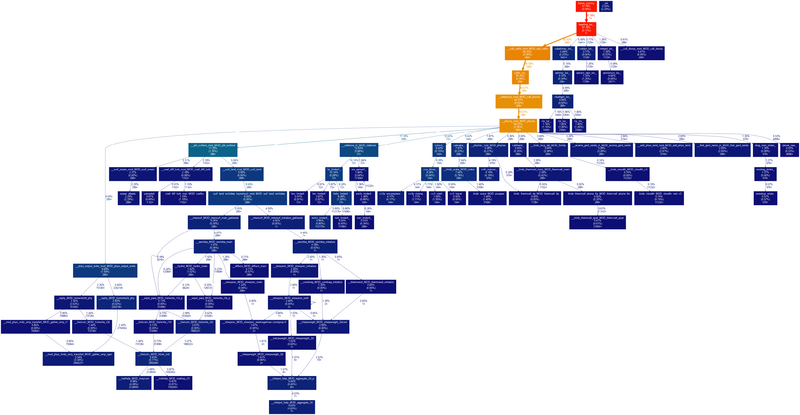
For a graphical representation, we recommend using gprof2dot, via gprof gcm.e | gprof2dot | dot -Tpng -o output.png. A typical example is shown below.
Profiling with scorep & scalasca
Scalasca (home, manual) is a profiling suite developed by Technische Universität Darmstadt Laboratory for Parallel Programming. It is much more capable than gprof, but also requires a heavier setup.
Installing scalasca
Some supercomputers have scalasca installed already, but for completeness here's a short guide to installing it locally (written 06/24, for v2.6.1):
All dependencies can be downloaded from here.
Compiling CubeBundle / CubeLib
Note: If you're on your own computer, we recommend installing CubeBundle, which includes CubeGUI. This requires Qt5 and OpenGL, which are a pain to install on supercomputers without sudo. For supercomputer local install, we recommand installing CubeW+CubeLib instead, and visualizing the results on your own computer.
No special instruction here - simply get the sources on the link above, extract them locally, and run ./configure --prefix=... && make -j 8 && make install.
Compiling scorep
Scalasca relies on scorep to instrument your code for profiling.
On clusters like Adastra, you need to make sure that clang in your path points to the system install: LD_LIBRARY_PATH="/usr/lib64:$LD_LIBRARY_PATH" ./configure --prefix=... && LD_LIBRARY_PATH="/usr/lib64:$LD_LIBRARY_PATH" make -j 8 && make install.
Note: make sure to load the right environment before compiling ! scorep can only instrument compilers it has detected when configured.
Compiling scalasca
Usual process: ./configure --prefix=... && make -j 8 && make install.
Note: Scalasca doesn't seem to like gcc-13 very much, but it doesn't need to be compiled with the same compiler as scorep.
Note: On Adastra, you need module load craype-x86-trento and we recommend module load gcc/12.2.0.
Note: To perform traces, Scalasca requires executables in $install_dir/bin/backend/ to be in the path. You can safely simply copy them to $install_dir/bin/ and add that to the path instead.
Using scalasca
Note: in doubt, read the manual, it's short and to the point.
Instrumenting the code
In the .fcm arch file used, replace the compiler (e.g. mpif90,mpicc) by scorep $compiler (e.g. scorep mpif90). Recompile the model.
Note: make sure to replace both the compiler and the linker. Do not replace the preprocessors.
Collecting statistics
Run scalasca -analyze $my_cmd, e.g. OMP_NUM_THREADS=2 scalasca -analyze mpirun -n 4 gcm.e. This will generate a scorep-gcm_4x2_sum folder locally.
Note: if the folder already exists, the analysis will halt.
Reading results
Note: if you are running on a cluster with CubeLib+CubeW as explained above, copy the generated folder scorep-* to the machine where you installed CubeBundle for the visualization.
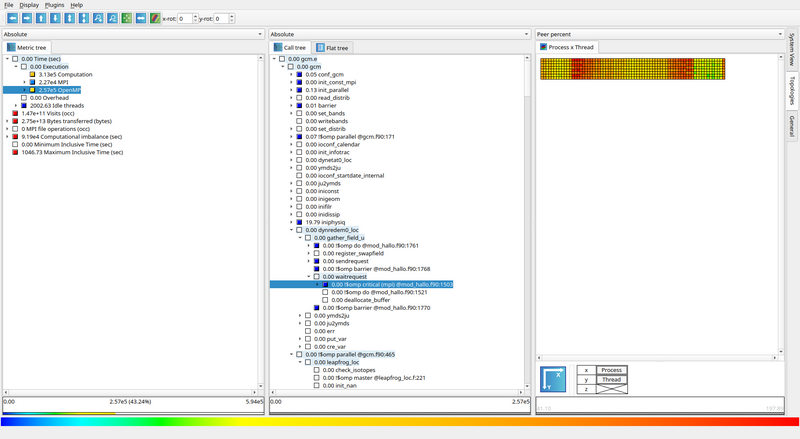
Run scalasca -examine scorep-*. The first time ran it will first compute some statistics, then it will open the results in CubeGUI.

