HowTo: Profiling LMDZ : Différence entre versions
De LMDZPedia
((WIP) Add gprof guide) |
(Aucune différence)
|
Version du 16 juillet 2024 à 18:57
Sommaire
Profiling with gprof =
The legacy way to profile the model is using gprof.
- Pros: available everywhere, easy to use
- Cons: old, bad handling of multithreaded applications, requires instrumentation
gprof is a rudimentary but simple to use tool to profile a sequential executable.
Instrumenting the code
In the .fcm arch file used, add -pg to BASE_FFLAGS and BASE_LD. Recompile the model.
Collecting statistics
Run the executable gcm.e. This will generate a gmon.out file locally.
Reading results
Run gprof gcm.e gmon.out > profiling.txt to get a textual view of the profiling.
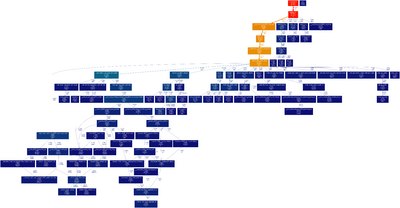
For a graphical representation, we recommend using gprof2dot, via gprof gcm.e | gprof2dot | dot -Tpng -o output.png. A typical example is shown below.
